How to Debugging Blue Pill (STM32F103C8) in Vscode
In the previous article, we successfully set up the Blue Pill (STM32F103C8) using Rust on Linux. Occasionally, while programming the STM32F103C8, we encounter issues during execution, such as the program not functioning according to the established logic. Therefore, we need to inspect variable values or registers while the program is running to identify the source of the problem. To fix these issues, we must perform a debugging process. On this occasion, we will learn how to prepare VSCode for debugging the Blue Pill (STM32F103C8).
Preparation
To perform debugging on the Blue Pill (STM32F103C8), we need to install several additional software components, such as a debugger, a GDB Server, and VSCode extensions.
Installing Debugger on Linux
A debugger is a program used to perform the debugging process. Since we are using the Fedora Linux distribution here, we will use the GNU Debugger. If you are using a different distribution, you may need to install arm-none-eabi-gdb, please adjust the installation according to the distribution you are using. To install the GNU Debugger on Fedora, you can use the following command:
sudo dnf install gdbInstalling VSCode Extension for Debugger
This extension serves to assist us in debugging the Blue Pill (STM32F103C8). It automatically runs the debugger, GDB server, also displays variables, registers, breakpoints, and more within VSCode. We will be using the Cortex-Debug extension. To install it, press CTRL+P in VSCode, enter the following command in the text entry that appears, and press ENTER:
ext install marus25.cortex-debugInstalling GDB Server
A GDB Server is a program that functions as a bridge, connecting the debugger to the microcontroller. Following the previous article where we used the ST-Link USB Downloader/Debugger, we will be using stlink as the GDB Server. Below is the command to install stlink on Fedora, if you are using a different distribution you can adjust the installation process accordingly:
sudo dnf install stlinkNote: We can also use
OpenOCDas a GDB server. In fact,OpenOCDsupports a wider range of devices beyond ST-Link, such as J-Link, CMSIS-DAP, and others.
System View Description (SVD) File for STM32F103C8
In addition to software, we also need an SVD file for the STM32F103C8 microcontroller to be used by the debugger. The SVD file contains the internal structure of the STM32F103C8, which allows the debugger to read the microcontroller’s registers. You can download the SVD file for the STM32F103C8 on this page. Choose the file named ‘en.stm32f1_svd.zip’. If you are using a different microcontroller, please download the corresponding file accordingly.
SVD is an XML-based file format that describes the peripheral registers, their memory addresses, and the individual bits of a microcontroller.
Debugging Blue Pill (STM32F103C8) in VSCode
Before we can perform debugging, we must set up the project configuration in VSCode by creating the launch.json and tasks.json files.
Configure Project for Debugging Blue Pill (STM32F103C8)
First, open your Rust project in VSCode. Then, click the ‘Run and Debug’ tab on the left and click on ‘create a launch.json file’. In the popup that appears, select ‘Cortex Debug’, which will automatically create the .vscode/launch.json file. Open that file and modify it as follows:
 1{
 2    "version": "0.2.0",
 3    "configurations": [
 4        {
 5            "name": "Rust Debug",
 6            "type": "cortex-debug",
 7            "request": "launch",
 8            "cwd": "${workspaceFolder}",
 9            "executable": "./target/thumbv7m-none-eabi/debug/single-conversion-poll", // Your binary
10            "servertype": "stlink", // GDB server type
11            "toolchainPrefix": "arm-none-eabi",
12            "gdbPath": "gdb",
13            "preLaunchTask": "cargo build", // Build project before flashing
14            "runToEntryPoint": "main",
15            "svdFile": "${workspaceFolder}/STM32F103.svd" // SVD file
16        }
17    ]
18}
Key Points:
- ‘name’: The name of the configuration. You may customize this as you prefer.
- ‘executable’: The binary file that will be flashed to the Blue Pill (STM32F103C8). Please ensure this matches your specific binary file path.
- ‘gdbPath’: The path to the debugger. If you are using the arm-none-eabi-gdb debugger, you can either remove this line or set it to arm-none-eabi-gdb.
- ‘servertype’: The type of GDB Server being used. Since we are using stlink here, we set this to stlink. If you are using a different GDB Server (such as openocd), please adjust accordingly.
- ‘preLaunchTask’: The task to be executed before the debugger starts. Here, we set it to the cargo build task so that the Rust project is automatically built before the program runs.
- ‘svdFile’: The file path where the SVD file is located.
Next, create a new task named ‘cargo build’ to match the preLaunchTask in the .vscode/launch.json file: Click the ‘Terminal menu’, then select ‘Configure Task’. In the popup menu that appears, select ‘rust: cargo build’, and the .vscode/tasks.json file will be automatically created. Open that file and modify it as follows:
 1{
 2	"version": "2.0.0",
 3	"tasks": [
 4		{
 5			"type": "cargo",
 6			"command": "build",
 7			"problemMatcher": [
 8				"$rustc"
 9			],
10			"group": "build",
11			"label": "cargo build"
12		}
13	]
14}
Make sure the content of the ‘label’ matches the content of the ‘preLaunchTask’ in the .vscode/launch.json file.
Process of Debugging Blue Pill (STM32F103C8)
To start the debugging process, select the ‘Run and Debug’ tab on the left side of VSCode, then click the ‘Run and Debug’ button, or simply press the F5 key on your keyboard. The VSCode interface will automatically switch to the debugging view, as shown below:
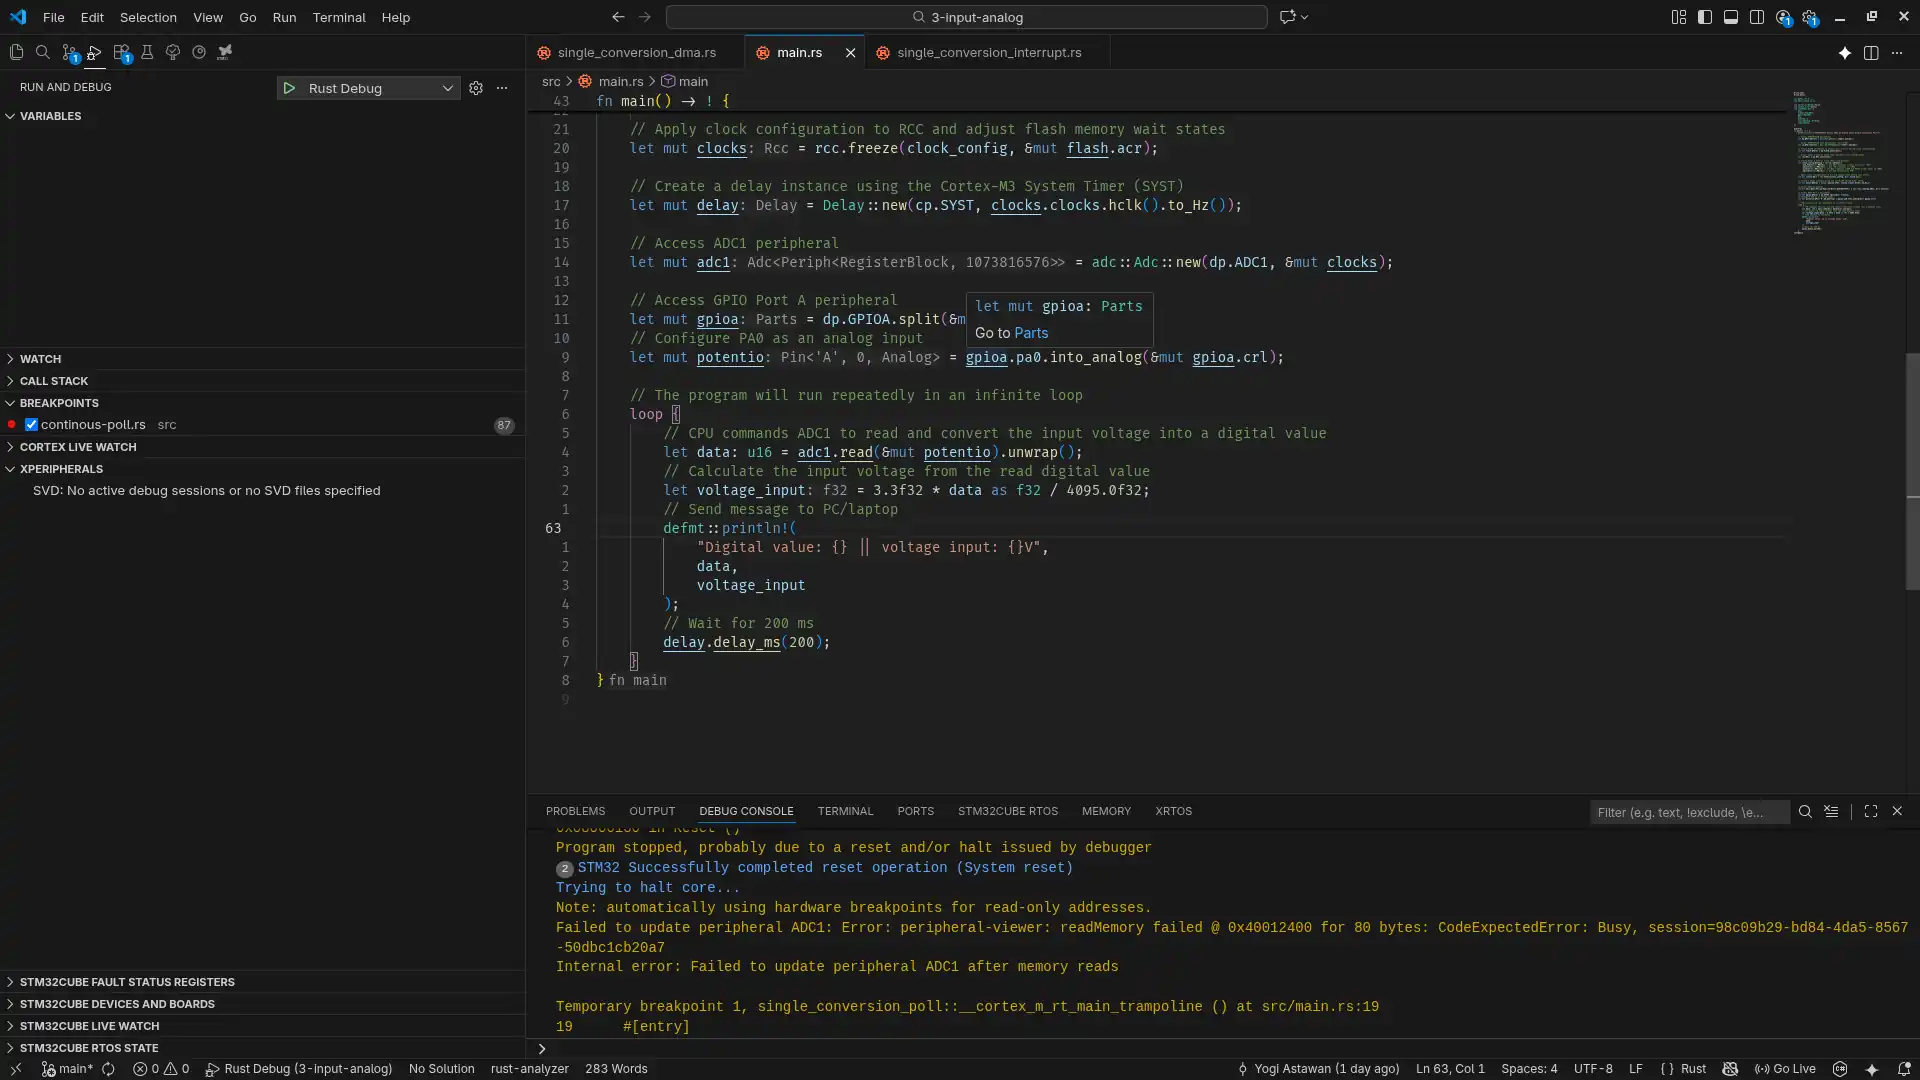
On the left side (left sidebar), we can view variable values, the call stack, and the register values of the STM32F103C8 microcontroller.
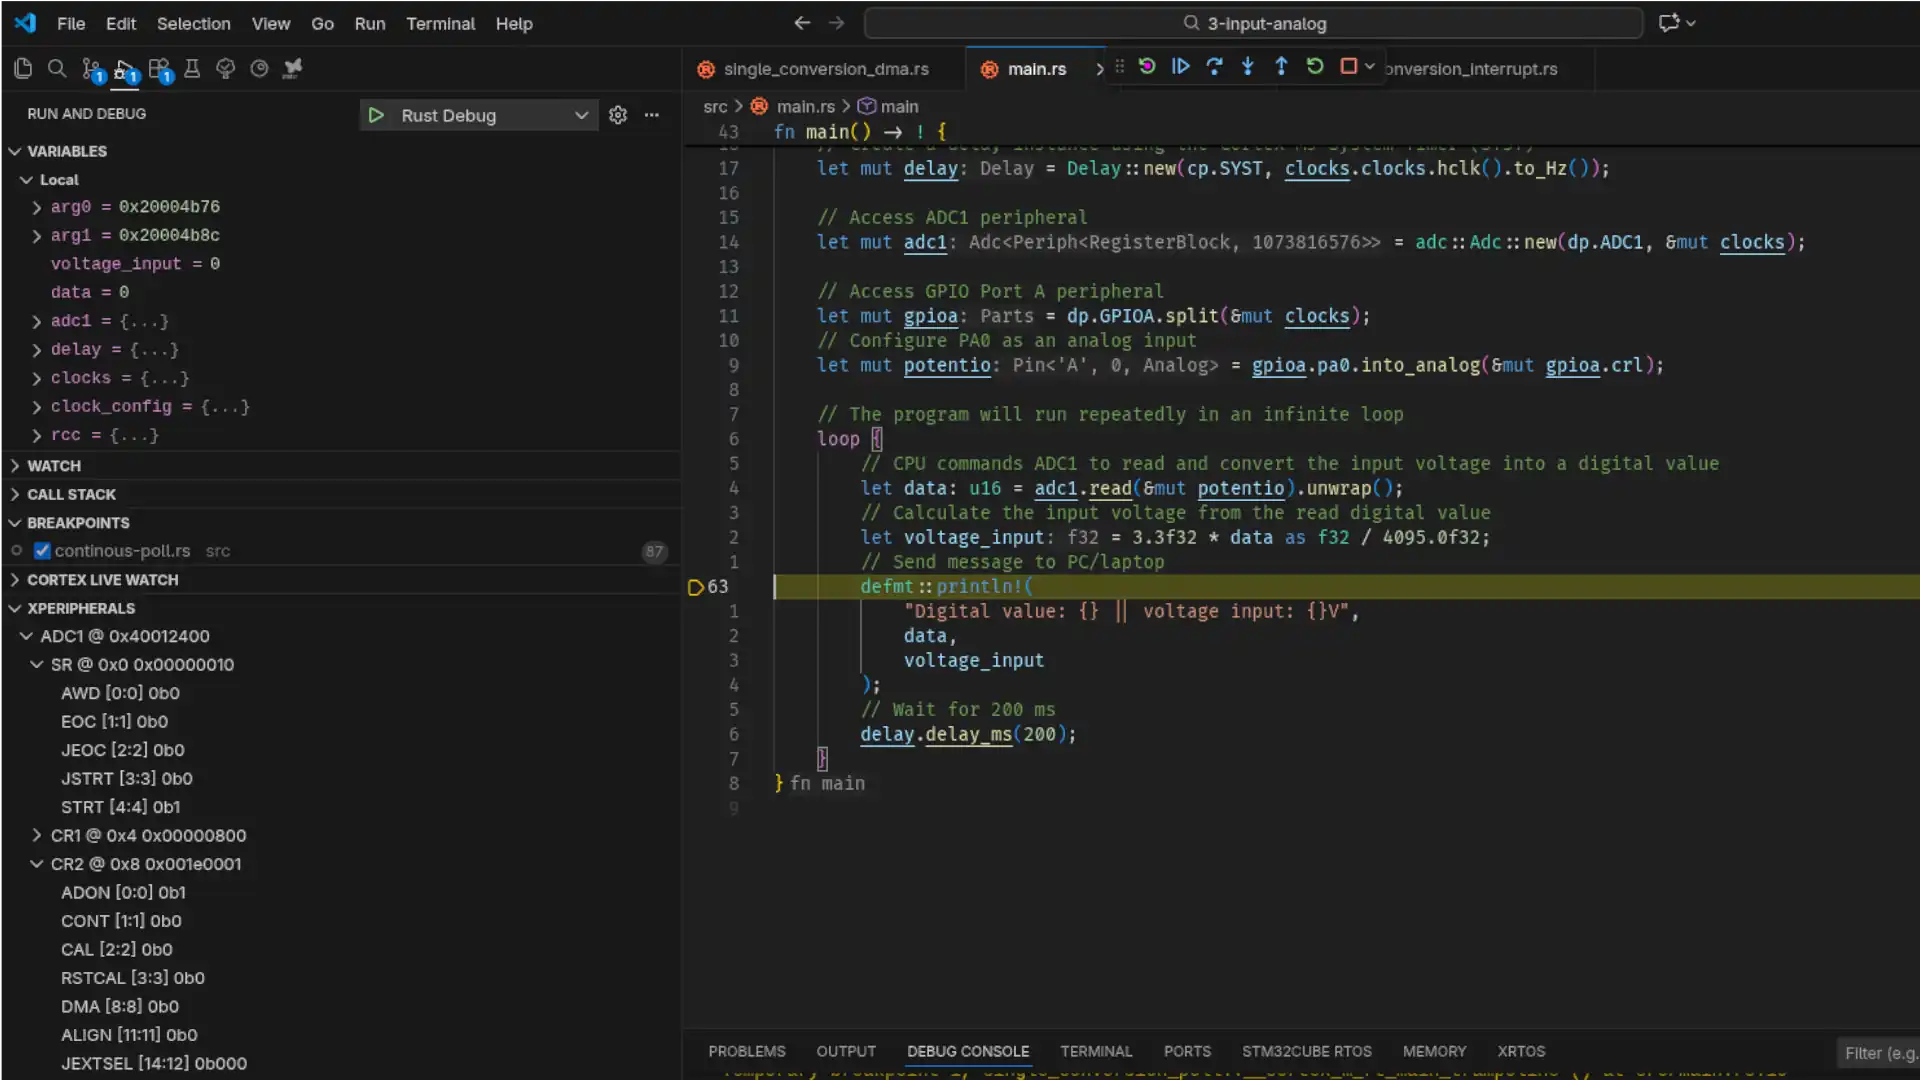
The following are the functions of several sidebar menus during debugging in VSCode:
- VARIABLES: Displays a list of names and values for both static and local variables.
- Call Stack: Displays the sequence of functions (methods) that have been called.
- Registers: Displays a list of names and values for both peripheral registers and the ARM Cortex-M3 CPU registers.
Pro Tip: Important shortcuts during the debugging process:
- F5: Continue running the program from a breakpoint.
- F10: Step Over (Execute the next line of code).
- F11: Step Into (Enter the current function and execute its first line).
- SHIFT+F11: Step Out (Exit the current function and return to the caller).
- CTRL+SHIFT+F5: Restart the program from the beginning.
- SHIFT+F5: Stop the debugging process.
Example source code can be accessed in the GitHub repository.
If you encounter any issues, or would like to provide feedback and suggestions, please contact us through the contact page.